
The Calibration Flow histogram plots 512 luminance values across a few hundred screen pixels. Each little vertical peak is barely one or two pixels wide. With the naked eye you see the overall shape of the tonal profile — where it rises, where it falls — but you can't tell a peak at value 240 from a peak at value 245. The difference is invisible at that resolution.
For rough calibrations, that's not a problem. To set the black point exactly on the threshold where your shadows begin, or to spot a small clipped peak at 255 that would signal blown highlights, you need to read each bin individually. The histogram loupe exists for exactly that.
#What you see
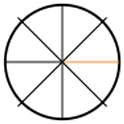
As soon as your mouse enters the histogram graph — or your finger touches it on a touchscreen — a white circle bordered in orange appears in the top right of the screen. Inside, you see the graph area around your cursor, magnified 1.5 to 1.8 times depending on the device. At the center, an orange cross marks your cursor's exact position.
Move the mouse along the graph: the loupe follows you, but stays pinned in its corner. You see, continuously, where you are. If you click a point to start dragging a threshold, the loupe stays on screen throughout the drag — it doesn't disappear at the moment you need it most.
In the graph's fullscreen mode, the loupe moves automatically to the top left of the screen, so it won't hide the button that closes fullscreen. That's the only position change in the app.
On iPhone, the loupe is smaller (100 pixels in diameter instead of 150 on desktop) and magnifies a bit harder (×1.8 instead of ×1.5), to compensate for the denser resolution of the touchscreen.
#Why it matters
Three concrete moments where the loupe changes the quality of what you do:
To place a threshold exactly. You adjust the black point with the slider. With the naked eye, you see your rough threshold land "somewhere left of the main peak". With the loupe, you see exactly which tonal value your threshold corresponds to, and you see where your shadows actually begin in the distribution. You can set your black point precisely at the foot of the peak instead of eyeballing it.
To detect a hidden peak. An image that looks well exposed sometimes has a small invisible peak at value 255 — a few hundred pixels in completely clipped highlights (a reflection, a hot spot, a burned-out detail). With the naked eye, that peak is buried in the tail of the graph. With the loupe, you spot it immediately. You fix the exposure before you print.
To compare two calibrations. If you compare last month's chemistry measurement to this month's, the two histograms overlap almost perfectly to the eye. With the loupe, you see the shifts of a few tonal units that reveal chemistry drift. That's the preventive diagnostic telling you it's time to mix a fresh batch.
#When you don't need it
For reading the overall profile — knowing whether an image is dark, light, contrasty, flat — the eye is enough. The loupe only serves pixel-by-pixel precision. You can spend weeks calibrating without ever using it and still get correct prints.
On a very high-density screen (Retina 5K or above), the native histogram is already very legible. The loupe's marginal gain shrinks. It stays useful for fine comparisons but becomes less essential.
And the loupe works only on the histogram graph. It doesn't activate on imported images, the media gallery, the options panel or the generated curves. To magnify a scanned image, the browser's or touch device's standard pinch and zoom gestures take over.
#Key facts
| Fact | Value |
|---|---|
| Position | Top right corner (left in fullscreen mode) |
| Size | 100 px (mobile <480px), 150 px (desktop) |
| Magnification | ×1.5 desktop, ×1.8 mobile |
| Activation | Automatic on hover or touch over the histogram |
| Persistence | Stays active while dragging a slider |
| Animation | 60 FPS, follows the cursor without lag |
| Targets in the app | Histogram graphs only (normal mode + Pro Mode) |
#The test
Import an image into Calibration Flow and move to the analysis step. Hover over the histogram graph with the mouse. The loupe appears immediately in the top right, with an orange cross at the center. Move slowly along the graph: you now see each bin individually instead of a mass of merged peaks. Now adjust the black point slider while keeping the cursor on the graph: the loupe stays on screen throughout the drag, and you read in real time the exact value where your threshold lands.