Tool · Quadricolour calibration chart · Free
Spot the colour drift of your processes, channel by channel.
The Color Venn chart generates 3 CMY circles that overlap into 7 measurable zones. You print, you make the print, you scan. The app analyses the overlaps and tells you where to adjust — without claiming guaranteed colorimetric precision, but to steer your settings where things really go wrong.
The chart
Three circles, seven measurable zones.
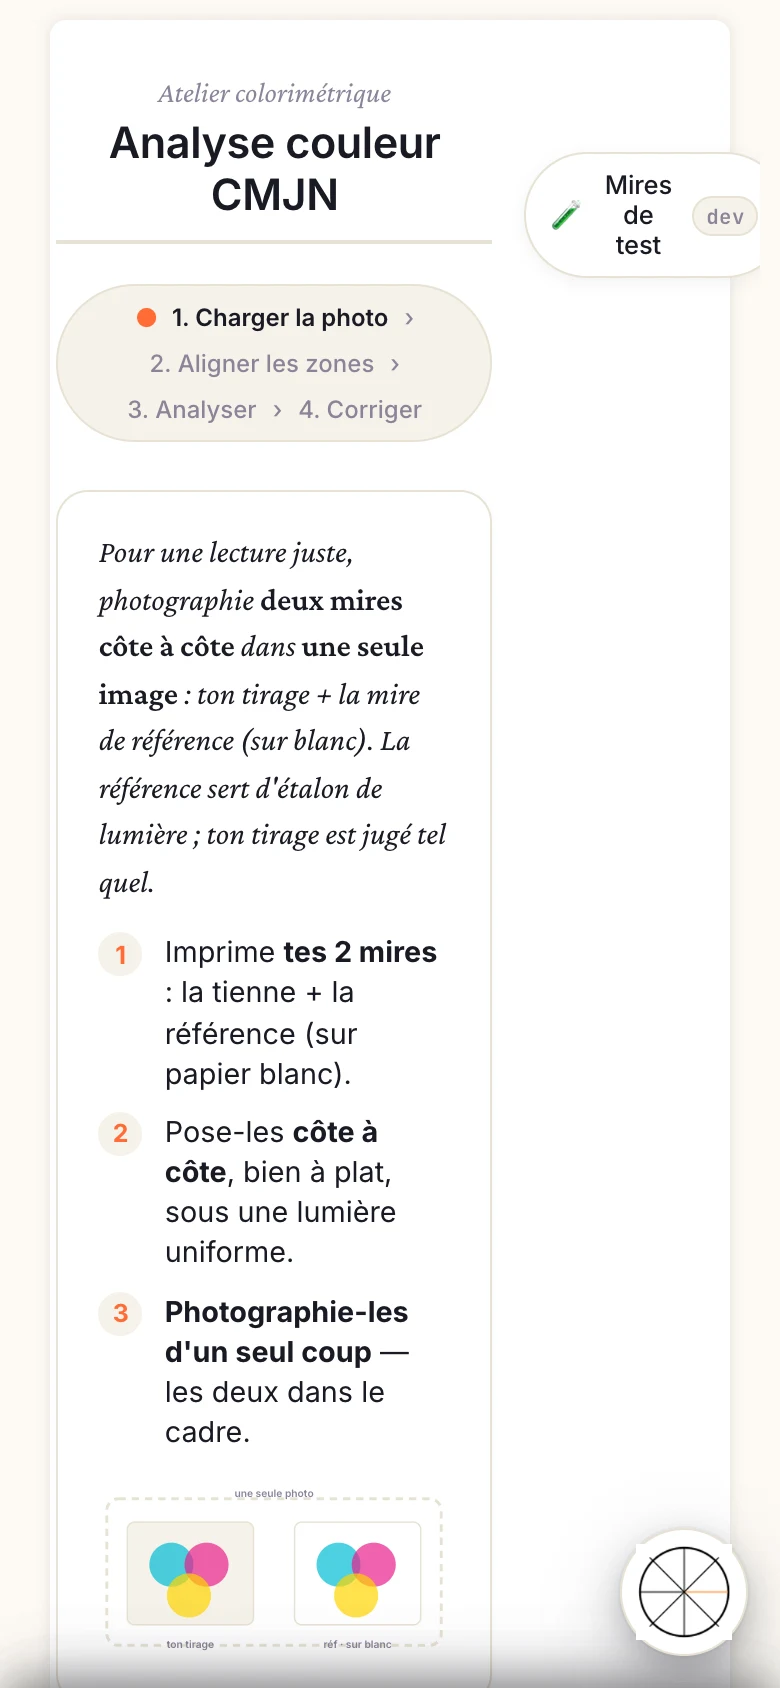
A CMYK Venn chart is made of three monochrome circles — Cyan, Magenta, Yellow — printed as flat fields and positioned to overlap. The overlaps create four extra zones: CM (blue), CY (green), MY (red), and CMY at the centre (black or brown depending on the process rendering). In total, 7 independent zones to analyse.
Zone C
Cyan only
Density and hue of the pure cyan channel.
Zone M
Magenta only
Density and hue of the pure magenta channel.
Zone Y
Yellow only
Density and hue of the pure yellow channel.
Zone CM
Cyan + Magenta
Overlap → blue. Reveals CM drift.
Zone CY
Cyan + Yellow
Overlap → green. Reveals CY drift.
Zone MY
Magenta + Yellow
Overlap → red. Reveals MY drift.
Zone CMY
Centre — 3 colours
Synthetic black: overall balance indicator.
Compatible processes
Built for quadricolour in alternative processes.
Aquaprint quadricolour
Non-toxic CMYK gum bichromate
Aquaprint (a VP process) lends itself naturally to quadricolour: 4 superposed C, M, Y, K layers, each exposed independently. The Venn chart calibrates the CMY overlaps so the optical mixes match your intent. Use the VP N°03 + N°04 + N°06 chemistries and the kits available on Vision Picturale.
Free access · sign-up required
Colour carbon
CMYK pigment carbon transfer
Colour carbon transfer stacks 3 to 4 pigmented tissues. Per-layer hue drift is hard to perceive by eye but accumulates in the overlaps. The Venn chart makes it readable: you know which layer to compensate before relaunching a print run.
Free access · sign-up required
Honest caveat
The Venn chart’s colour analysis is still being made more reliable. The results are useful to spot drift and steer your adjustments, not to certify ΔE2000 conformity or a guaranteed print rendering. Treat them as a direction indicator, not a proofing measurement.
Go further
Understand quadricolour, not just measure it.
- Picturale Academy on NOEME — learn quadricolour in alternative processes: CMYK Aquaprint modules, colour carbon, channel separation, layer order. The theory behind the tool.
- Manuel · Color Venn CMJN — full documentation: generation parameters, deviation interpretation, export of corrections.
- Aquaprint kits — Vision Picturale — non-toxic VP chemistries N°03/N°04/N°06, Aquaprint process in 3 variants (CMYK Quadri, Sanguine, Mono).
- 21-step chart (tonal) — single-layer tonal calibration before tackling quadricolour.
- Gum bichromate calibration
- Carbon calibration
Start reading your colours, not guessing them.
Color Venn is free — sign-up required, 300 MB included. Pro access at €9.90/month for advanced tonal calibration and .acv curve export. Available on Web and iOS app.
Luminograph access (1 year) for Vision Picturale Luminograph programme recipients.
Generate my Color Venn chart — free
Workflow
Four steps, from generation to adjustment.
Generate the chart in the app
Open Calibration Flow on web or iOS, select the Color Venn tool and generate the chart at your format size. Download the file and slot it into your usual CMYK separation flow.
Make the full print
Print the 4 negatives (C, M, Y, K) and run the successive exposures for your process — Aquaprint layer by layer or colour carbon transfer. Black is not analysed by the Venn chart; it comes in as the final layer.
Scan and import
Scan the print flat (transmission or reflection scanner depending on the medium). Import the image into Calibration Flow. The app automatically locates the 7 chart zones.
Read the proposed adjustments
The app compares the measured values to the theoretical targets and shows the per-channel drift. It points you to the corrections to make on your .acv curves — exposure density, hue correction, or CMY rebalancing. The results guide your adjustments; the final decision stays yours.