Encyclopedia · Tonal metrology
Optical density
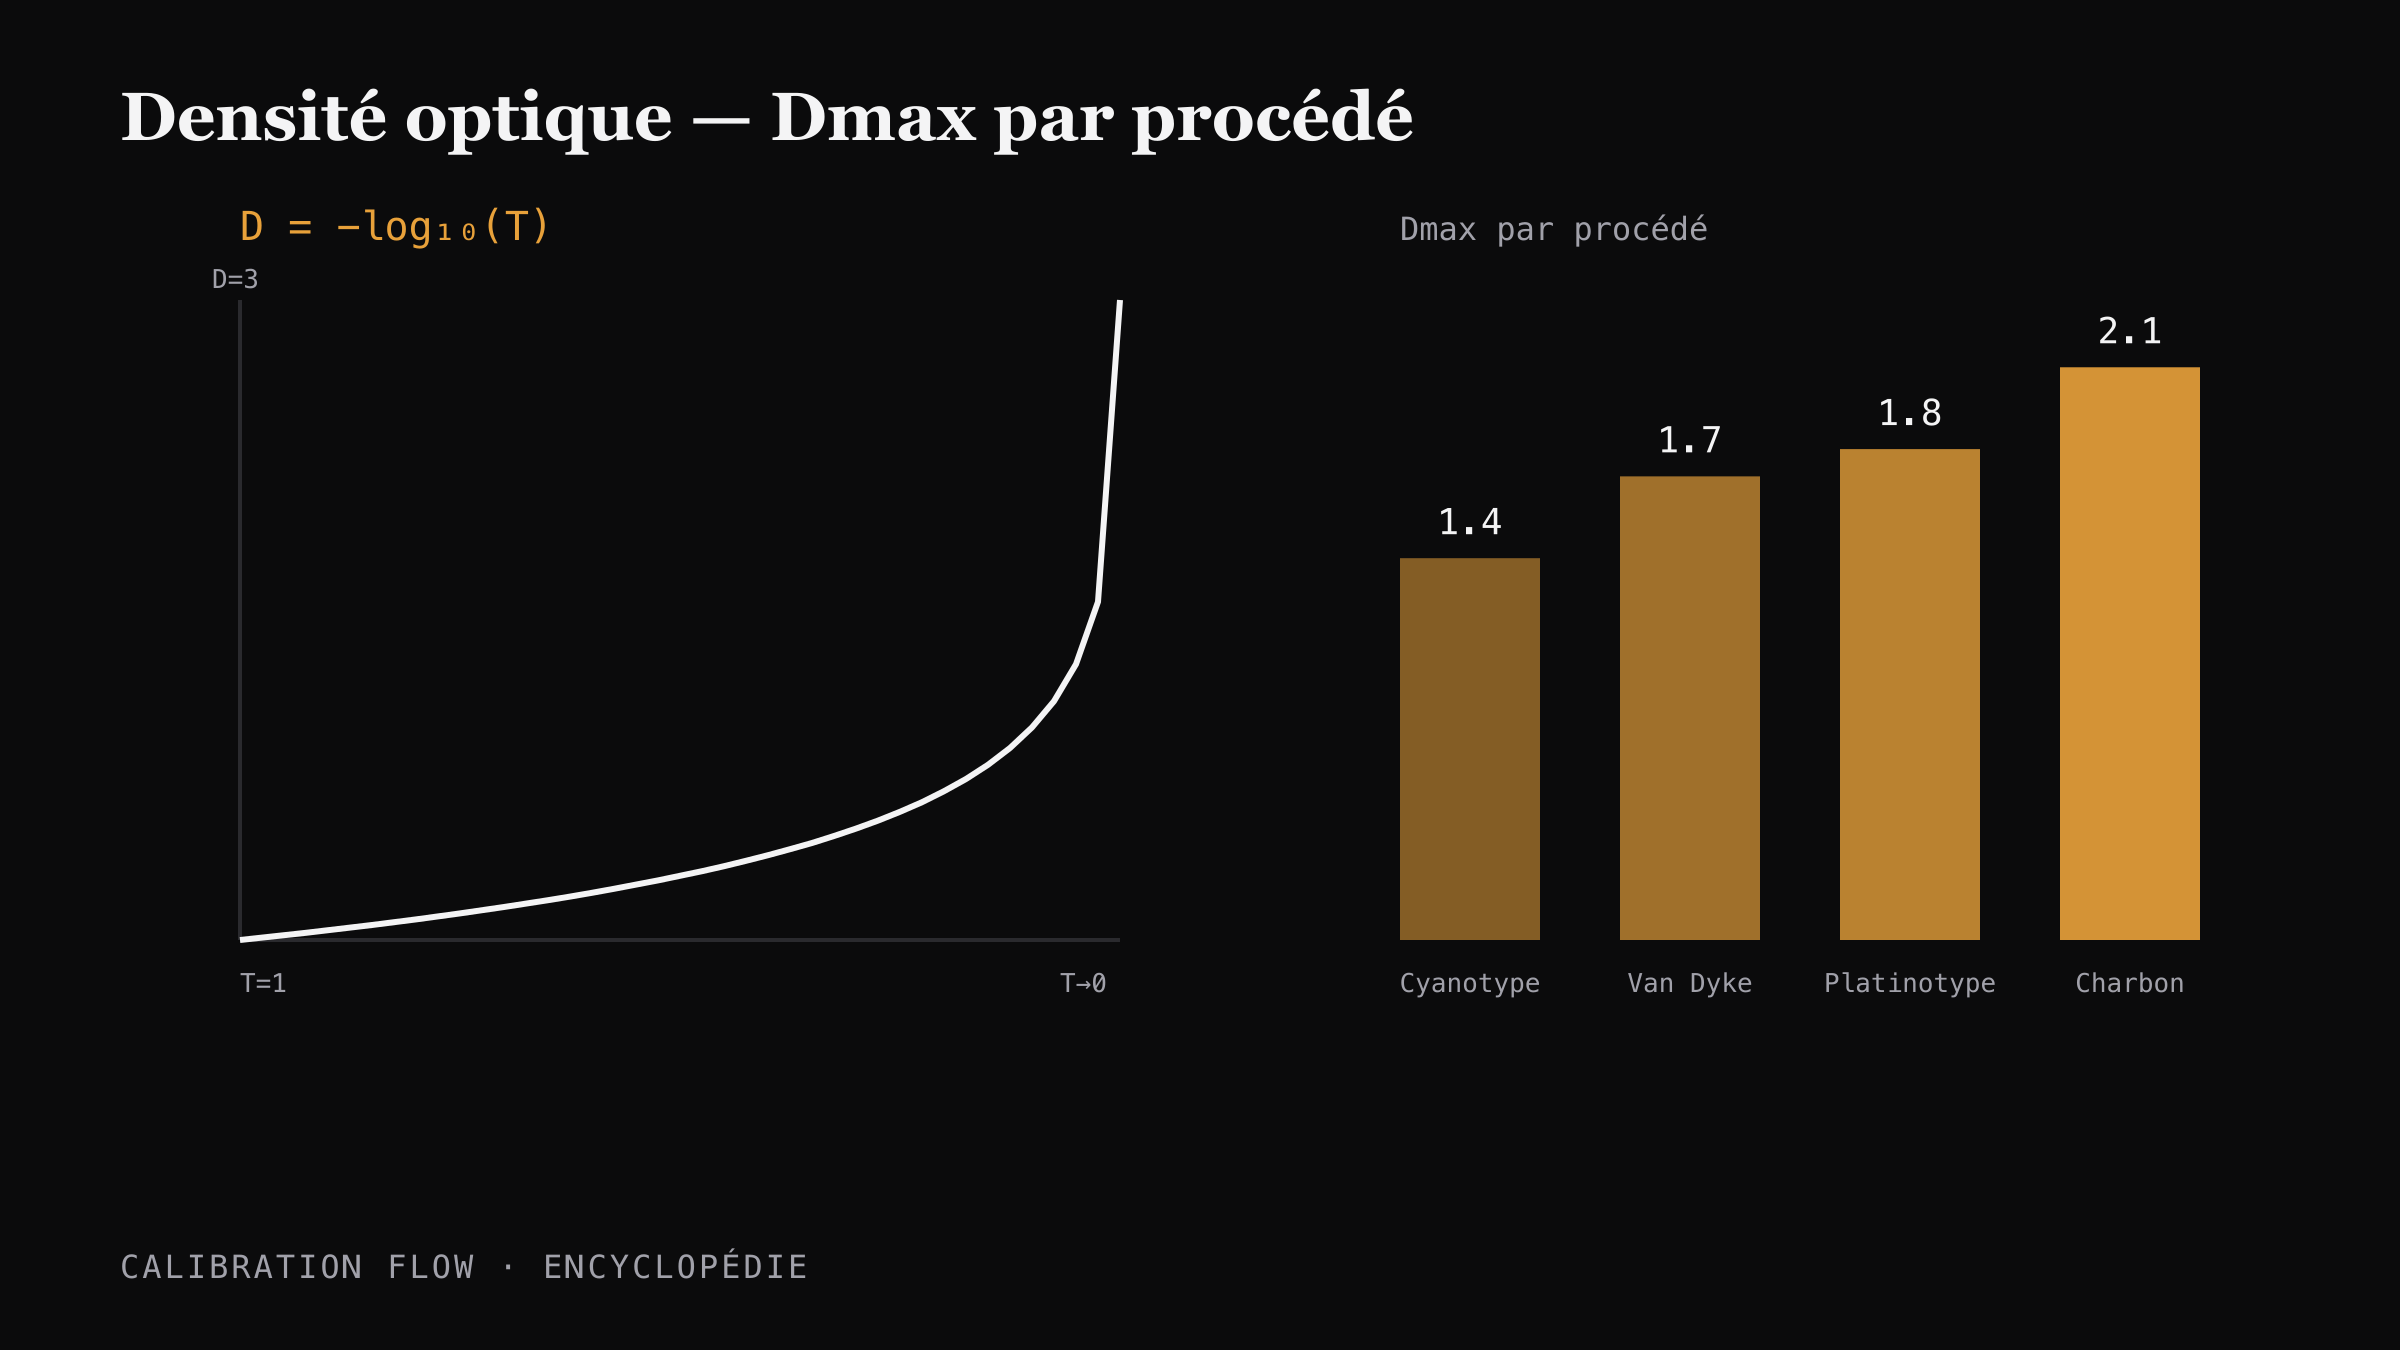
Optical density is the historical photographic opacity measure defined by D = -log₁₀(T), where T is the transmittance. A density of 1.0 transmits 10% of the light, 2.0 transmits 1%. Formalised by Hurter and Driffield in 1890.
Verified on 2026-05-19 by the Calibration Flow team.
Context and history
Ferdinand Hurter and Vero Charles Driffield published in 1890 their study Photochemical Investigations and a New Method of Determination of the Sensitiveness of Photographic Plates, which founded modern sensitometry. Optical density D became the standard unit of silver photography: it describes the amount of light blocked by a negative, independently of wavelength, using a hardware densitometer.
All later vocabulary — characteristic curve, Dmin, Dmax, gamma, exposure index — derives from this reading grid. In alternative photography, density remains the common language for describing the depth of a black: a platinum/palladium print reaches Dmax 1.8 on Hahnemühle Platinum Rag, a carbon print goes below 2.1.
But optical density requires a calibrated transmission or reflection densitometer, an expensive instrument rare outside the lab. That is why modern software tools bypass density in favour of measurements from the camera or phone sensor.
How optical density works
The canonical formula: D = -log₁₀(I/I₀) = -log₁₀(T), where I₀ is the incident intensity, I the transmitted intensity and T = I/I₀ the transmittance. The scale is logarithmic, which makes density additive: stacking two filters of density 0.5 each gives a total density of 1.0.
Three derived quantities are essential:
- Dmin — density of the paper white (typically 0.05 to 0.15 on unsensitised paper).
- Dmax — density of the deepest reproducible black. Varies widely by process (cyanotype 1.4 / carbon 2.1+).
- Tonal range — Dmax − Dmin. Determines the number of visually distinct steps between black and white.
For reference: a negative of Dmax 2.5 blocks 99.7% of the light, a Dmin of 0.1 lets 79% through. It is this range that defines how much UV reaches the various zones of the sensitised paper during exposure.
Why Calibration Flow does not use optical density
An explicit methodological choice: Calibration Flow measures perceptual L* CIELAB luminance, not optical density. L* luminance is the lightness component of the CIE L*a*b* colour model, calibrated to track human perception of grey: an L* of 50 corresponds to a mid-grey, independently of the room where the measurement is made.
Three technical reasons justify this choice:
- No densitometer required — an iPhone camera sensor is enough. Optical density requires an expensive hardware densitometer.
- Perceptual scale — L* is designed so that equal differences correspond to equal visual differences. Density, being logarithmic, requires a mental conversion.
- Lighting robustness — L* normalisation via the ITU-R BT.709 coefficients on linearised RGB reasonably compensates for ambient lighting variations.
The app computes an L* histogram on 512 bins and applies the tonal correction in that space. Optical density remains useful as common vocabulary, though — every Dmax value cited in the manual and on the process pages is a literature reference (Christopher James, Bostick & Sullivan).
Typical Dmax by alternative process
Values observed in the literature on recommended substrates. They serve as a reference for judging the expected black depth.
| Process | Typical Dmax | Reference substrate | % light returned |
|---|---|---|---|
| Cyanotype | 1.4 | Arches 300 g | ~4 % |
| Van Dyke | 1.5 — 1.7 | Hahnemühle Platinum Rag | ~2 — 3 % |
| Resinotype | ~1.7 | VP baryta paper | ~2 % |
| Platinum/Palladium (Pt/Pd) | 1.8 | Hahnemühle Platinum Rag | ~1,6 % |
| Carbon (carbon transfer) | > 2.1 | Pigmented gelatin + transfer paper | < 0,8 % |
Sources: Christopher James, The Book of Alternative Process Photography; Vision Picturale datasheets.
Sources and references
- Ferdinand Hurter and Vero C. Driffield, Photochemical Investigations and a New Method of Determination of the Sensitiveness of Photographic Plates, 1890 — founding paper of sensitometry.
- Christopher James, The Book of Alternative Process Photography — Dmax and characteristic curves of each process.
- Wikipedia — Absorbance: en.wikipedia.org/wiki/Absorbance.
- CIE, CIE 015:2018 Colorimetry — official reference on the L*a*b* space.
Go further
- L* CIELAB tonal analysis in the manual — how Calibration Flow really measures the patches.
- Cyanotype page (Dmax 1.4).
- Glossary — Optical density entry.